Water Supply And Wastewater Engineering: Unit III: Water Storage And Distribution
Water Storage Capacity of Distribution Reservoirs
The primary function of a distribution reservoir is to meet the fluctuating demand. The quantity of water required to be stored in the reservoir for balancing the variable demand is called balancing storage of the distribution reservoir.
STORAGE
CAPACITY OF DISTRIBUTION RESERVOIRS
The
total storage capacity of a distribution reservoir is the total of
1.
Balancing storage (or equalising or operating storage)
2.
Breakdown storage.
3.
Fire storage
1. Balancing or
Equalising Storage:
•
The primary function of a distribution reservoir is to meet the fluctuating
demand.
•
The quantity of water required to be stored in the reservoir for balancing the
variable demand is called balancing storage of the distribution reservoir.
•
This can be found by following methods :
(a)
Hydrograph Method.
(b)
Mass curve Method.
(c)
Analytical Methods.
(a) Hydrograph Method :
•
The water demand is not constant and varies hourly.
•
The demand is more during peak hours in the morning and evening. A
•
A hydrograph of hourly demand for maximum day is shown in figure 3.5.
•
The pumping rate i.e. mean of hourly demand is shown by line PQ.
•
The storage is obtained by determining the shaded area between curve BE and
line PQ.

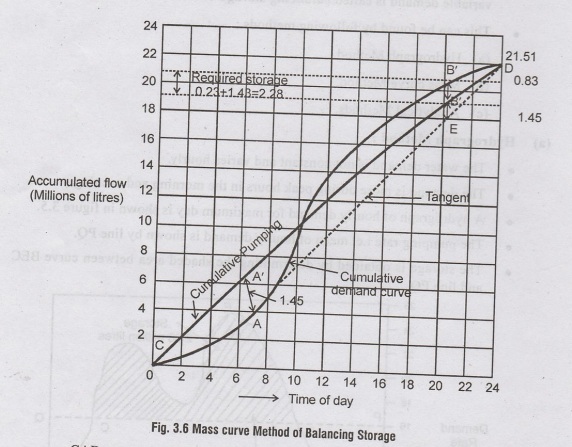
(b) Mass Curve Method:
A
mass curve is the cumulative demand curve which is obtained by continuously
adding the houly demands of the maximum day and plotting against time.
Figure
3.6 shows the mass demand curve CAB plotting it against hours of maximum day.
•
CAB curve continuously rises.
•
Steepness of curve indicates high rate demand.
•
Flatness of curve indicates low rate demand.
•
Line CD is the cumulative pumping at uniform rate (join ends C&D)
•
Draw tangents through the lowest point A and highest point B parallel to line
CD.
•
The highest vertical distance BE between the twe
•
At 6 AM there is excess supply = AA' which should be stored.
•
At 8.30 PM there is deficit (BB') which must be drawn from storage
Therefore,
Storage = Morning excess AA' + Evening deficiency BB'
S
= Ep+ Ed
Where
S = Storage capacity required
Ep
= maximum excess supply through pumping
Ed
= maximum excess demand (maximum deficiency)
(c) Analytical Method
The
cumulative hourly demand and cumulative hourly supplies are tabulated for 24
hrs. The summation of maximum excess demand and the maximum excess supply gives
the balancing storage.
2. Breakdown storage
(Emergency storage)
•
It is the storage for emergencies due to pump failure, power failure and during
repair works.
•
It is difficult to determine this storage as it depends upon the frequency and
extent of failures.
•
Generally, 25% of total storage capacity of reservoir or about 11⁄2 to 2 times
average hourly supply may be considered as breakdown storage.
3. Fire Storage:
•
This storage is required for fire fighting, which depends on the chances of
fire and duration of fire.
• The National Board of Fire Under
Writers (America) recommends that the reserve should
supply water for 10 hours for fire fighting in communities of 6000 people and
for 8, 6 and 4 hours in places with 4000, 2000 and 1000 people respectively.
•
For 10 hours of fire fighting per day, the volume of water required to be
stored should be 2 million litres.
Fire
reserve is determined from the formula :
R
= [F-P] T
P
= reserve fire pumping capacity, litres/min
T=
duration of fire, minutes.
McDonand
has suggested the following expression

Where,
R
= total storage capacity (million litres)
D=
average domestic demand for maximum month (MLD)
F
= fire demand (MLD)
P
= Pump capacity (MLD)
a,b
= Coefficients; 0.2 and 0.1 respectively.
Problem 5.1:
A
town with a population of one lakh is to be supplied with water daily at 200
litres per head. The variation in demand is as follows

Determine
the capacity of service reservoir assuming pumping at uniform rate and the period
of pumping to be from 6 am to 6 pm.
Neglect
fire demand.
Solution:
Total
daily requirement = 1,00,000 x 200 litres = 2 x 10⁷ litres = 20 ML
(a) Analytical Solution
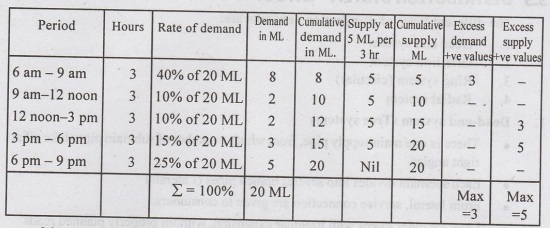
Max.
excess demand = 3 ML
Max.
excess supply = 5 ML
Total
storage = 3+5 = 8ML
(b) Mass curve method
Graph
is plotted between time and cumulative demand.
Pumping
rate = 20 ML /12 hr = 1.667 ML | hr
The
supply curve is drawn with slope as 1.667 ML/hr. Maximum ordinates are found
between supply and demand lines.
Storage
= 3 ML + 5 ML = 8 ML

Water Supply And Wastewater Engineering: Unit III: Water Storage And Distribution : Tag: : - Water Storage Capacity of Distribution Reservoirs
Related Topics
Related Subjects

Water Supply and Wastewater Engineering
CE3303 3rd Semester Civil Dept 2021 Regulation | Tag: 3rd Semester Civil Dept 2021 Regulation