Water Supply And Wastewater Engineering: Unit I: Water Supply
Predicting Demand for Water
types of water demand
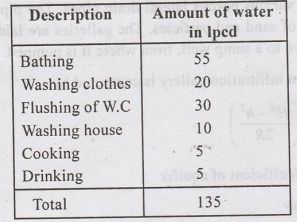
The water required in residential buildings for drinking, cooking, bathing, gardening, flushing etc.The domestic water demand is 50 to 60% of the total water consumption.The demand may vary according to the living conditions of consumers (LIG/ MIG/HIG).
PREDICTING
DEMAND FOR WATER
The
various types of water demand which a city may have is classified as:
1.
Domestic water demand (Residential)
2.
Industrial water demand
3.
Institutional and Commercial water demand
4.
Demand for public uses
5.
Fire demand
6.
Water required to compensate losses in wastes and thefts
1. Domestic water
demand
•
The water required in residential buildings for drinking, cooking, bathing, gardening,
flushing etc.
•
The domestic water demand is 50 to 60% of the total water consumption.
•
The demand may vary according to the living conditions of consumers (LIG/
MIG/HIG).
•
LIG-Low income group
Table
1.1: Minimum domestic water consumption for Indian cities
2. Industrial water
demand
•
Represents the water demand of industries (existing and anticipated in future)
•
The demand varies according to the number and type of industries in the city.
•
The average per capita consumption for industrial needs is 50 lpcd.
•
In Industrial cities, the per capita water requirement is 450 lpcd.
•
Water demand of certain industries is given below:
a.
Automobile - 40 kilo litre per vehicle produced
b.
Leather - 40 kilo litre per tonne produced
c.
Textile - 80 to 140 litre per tonne produced
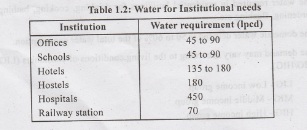
3. Institutional and
Commercial water demand
Water
requirement of Institutions such as Hotels, Hospitals, Schools, Colleges,
Offices, Railway Stations, Factories etc.
The
water demand depends on the nature of city and number of commercial
establishments.
On
an average, the per capita demand is 20 lpcd.
4. Demand for public
or civic use
The
quantity of water required for public utility purposes such as watering of
public parks, gardening, washing and sprinkling on roads, public fountains etc.
It
accounts to 5% of the total water consumption
On
an average, it is 10 lpcd
5. Fire demand
In
thickly populated and industrial areas, fire outbreaks may cause serious damages.
The quantity of water required for fire fighting is called fire demand and it
is stored in Storage reservoirs. The minimum water pressure available in fire
hydrants should be 100 to 150 kN/m2 (10 to 15 m of water head).
For
cities having population > 50,000, water required for fire fighting in kilo
litre.
=
100 √P, where P = population in thousands.
Rate of Fire Demand
Empirical
formulae are used to calculate fire demand.
(i) Kuichling's Formula
Q=3182
√P mano no
Q
= Water required in litre/minute
P
= Population in thousands
(ii) Freeman formula
Q-1136[P/10+10]
(iii) National Board of Fire Under
Writers formula
(American
Insurance Association)
(a)
For a central congested high valued city
(i)
Population ≤ 2,00,000
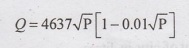
(ii)
Population > 2,00,000
(b)
For a residential city, the water required for fire fighting is as follows:
Small
buildings - 2200 litre/minute
Larger
buildings - 4500 litre/minute
High
rise Apartments - 7650 to 13,500 litre/minute
(iv) Buston's formula
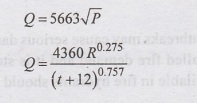
This
formula takes into account probability of occurrence of fire.
t
- duration of fire (minimum 30 min)
R-
period of occurrence of fire (minimum 1 year)
6. Water required to
compensate losses (thefts/wastes)
(i)
Leakage/overflow from service reservoirs
(ii)
Leakage from main/ service pipe connections
(iii)
Leakage/losses on consumer's premises (unmetered)
(iv)
Leakage from public taps
(v)
Defective pipe joints
(vi)
Cracked pipes
(vii)
Loose valves/ fittings
(viii)
Unauthorised water connections
(ix)
Damaged meter
PER CAPITA DEMAND
The
per capita demand (q) in litres per day per head (annual average daily
consumption per person)
=
Total yearly water requirement of city in litres / 365×Design population
Factors
affecting per capita demand
1.
Size of City / Type of Community - The fluctuations in demand depends upon th
size of city.
•
Large city-fluctuations are less and
demand is more
•
Small city - demand is less
•
Residential Community - more fluctuations in demand
•
Industrial Community - Fluctuation is
less
2.
Standard of living/habits of people
•
Higher the standard of living - demand
for water is more
3.
Climatic conditions
•
Hot climate - Usage of water will increase (bathing, lawn sprinkling etc.)
•
Cold climate - Water is wasted to prevent freezing of pipes
4.
Quality of water
•
Good quality water - usage
•
Poor quality water - usage is less.
5.
Pressure in the supply
•
High pressure - increased usage.
•
Low pressure - decreased usage.
6.
System of supply - water supply may be continuous (24 hrs) or intermitter
Intermittent supply reduces the demand.
7.
Sewerage - Flushing system increases water demand.
8.
Policy of metering - Use of water decreases when the supplies are metered.
9.
Water rates - Increase in water rates reduces the consumption
10.
Age of community - Older communities use less water. Developing new communiti
require large quantity of water for construction works.
11.
Lawn sprinkling - Enforcement of lawn sprinkling regulations can reduce pe
demands.
VARIATIONS
IN DEMAND
The
per capita consumption of water varies seasonally, monthly, daily and hourly.
(i) Seasonal
variations
Summer
season - large use of water.
Winter
season - lesser use of water.
Rainy
season - much lesser use of water.
(ii) Daily variations
Sundays
/ Holidays - more usage of water.
Weekdays
- less usage of water.
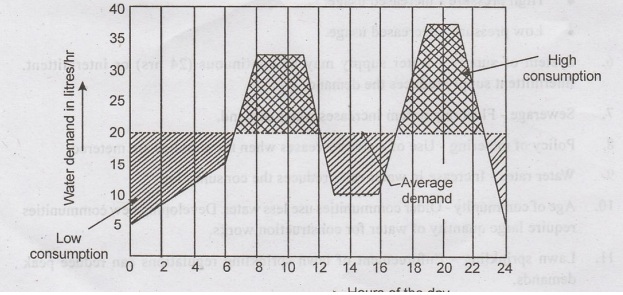
(iii) Hourly
variations
Early
morning (0 to 6 hours) - less consumption of water.
Between
8 to 11 am - Peak consumption of water.
Between
1 to 4 pm - Water consumption is less.
Between
7 to 9 pm - high or peak consumption of water
Late
night hours - Minimum consumption of water
The
hourly variations in water demand is shown in figure 1.8
Assessment of Variations in Demand
(i)
Maximum daily consumption 180% of average daily demand 100 ylish mumix=1.8
Where
q = average daily demand
(ii)
Maximum hourly consumption (peak demand) = 150% of its average hourly
cosumption
=
1.5 x Average hourly consumption of maximum day
(iii)
Maximum hourly consumption of maximum day
1.5
x [Max. daily demand /24]
Effect of variations in demand on
the design capacities of different components of a water supply scheme.
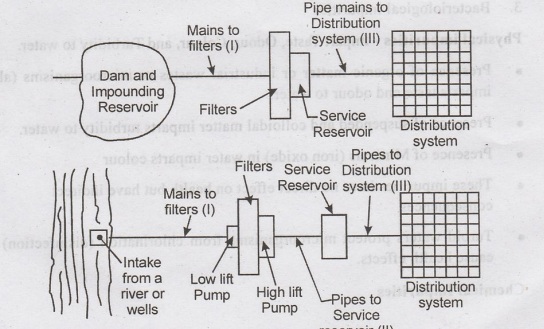
1.
Source of supply - Designed for maximum daily consumption
2.
Pipe Mains (Type I & II) - Designed for maximum daily consumption
3.
Filter and other units of water treatment plant - Designed for maximum daily
consumption or twice the average daily consumption (including reserve for repairs)
4.
Pumps - Same as filter and WTP units
5.
Distribution system (Type III) - Designed for maximum hourly demand of maximum
day plus reserve for fire
6.
Service reservoir - Designed for hourly
fluctuations, fire demand, emergency reserve etc.
Water Supply And Wastewater Engineering: Unit I: Water Supply : Tag: : types of water demand - Predicting Demand for Water
Related Topics
Related Subjects

Water Supply and Wastewater Engineering
CE3303 3rd Semester Civil Dept 2021 Regulation | Tag: 3rd Semester Civil Dept 2021 Regulation