Construction Materials And Technology: UNIT V: Construction Planning
CPM and Pert Network Modelling and Time Analysis
Construction Planning
Any project involves planning, scheduling and controlling a number of interrelated activities with use of limited resources like, men, machines, materials, money and time. The projects may be extremely large and complex such as construction of a power plant, a highway, a shopping complex, ships and aircraft.
CPM AND PERT NETWORK MODELLING AND
TIME ANALYSIS
Any
project involves planning, scheduling and controlling a number of interrelated
activities with use of limited resources like, men, machines, materials, money
and time. The projects may be extremely large and complex such as construction
of a power plant, a highway, a shopping complex, ships and aircraft. It is
required that managers must have a dynamic planning and scheduling system to
produce the best possible results and also to react immediately to the changing
conditions and make necessary changes in the plan and schedule.
A convenient analytical and visual technique of PERT and CPM prove extremely valuable in assisting the managers in managing the projects. PERT and CPM are basically time-oriented methods in the sense that they both lead to determination of a time schedule for the project. The significant difference between two approaches is that CPM is an activity oriented network while PERT is event oriented. CPM has single time estimate which is assumed to be deterministic and PERT has three time estimates for activities and uses probability theory to find the chance of reaching the scheduled time.
NETWORK DIAGRAM REPRESENTATION
In
a network representation of a project the following representations are used:
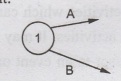
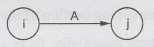
Activity:
Any individual operation which utilizes resources and has an end and a
beginning is called activity. An arrow is commonly used to represent an
activity with its head indicating the direction of progress in the project.
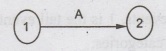
Here
'A' is the activity. These are classified into four categories:
(i)
Predecessor activity - Activities that must be completed
immediately prior to the start of another activity are called predecessor
activities.
(ii) Successor activity - Activities that cannot be started
until one or more of other activities are completed but immediately succeed
them are called successor activities.
(iii) Concurrent activity - Activities which can be
accomplished concurrently are known as concurrent activities. It may be noted
that an activity can be a predecessor or a successor to an event or it may be
concurrent with one or more of other activities.
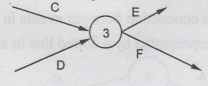
(iv) Dummy activity An activity which does not consume any kind of resource and
time is called a dummy activity. Dummy activities are simply used to represent
a connection between events in order to maintain logic in the network. It is
represented by a dotted line in a network.
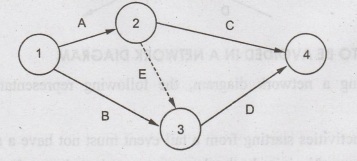
In
the above example, A and B are preceding activities. C is dependent on activity
A and D is dependent on activity B. Also A and B are concurring activities,
since they are starting at the same time. Activity E is the dummy activity and
it is marked as dotted line.
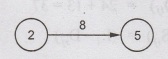
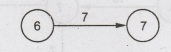
❖ Event: An event represents a point in time
signifying the completion of some activities and the beginning of new ones.
This is usually represented by a circle in a network which is also called a
node or connector.
Here
'1' and '2' are called events. 1 is the tail event and 2 is the head event. The
events are classified in to three categories:
(i) Merge event - When more than one activity comes
and joins an event such an event is known as merge event.
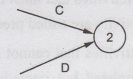
(ii) Burst event - When more than one activity
leaves an event such an event is known as burst event.
(iii) Merge and Burst event - An event may be merge and burst
event at the same time as with respect to some activities it can be a merge
event and with viorespect to some other activities it may be a burst event.b
ERRORS TO BE AVOIDED IN A NETWORK DIAGRAM
While
drawing a network diagram, the following representations should be avoided:
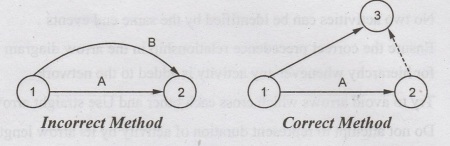
(i)
Two activities starting from a tail event must not have a same end event. To
ensure this, it is absolutely necessary to introduce a dummy activity.
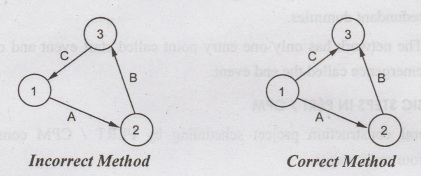
(ii)
Looping error should not be formed in a network, as
it represents performance of activities repeatedly in a cyclic manner.
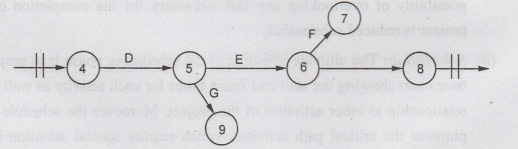
(iii) Dangling: To disconnect an activity before
the completion of all activities in a network diagram is known as dangling. As
shown in the figure activities (59) and (6-7) are not the last activities in
the network. So the diagram is wrong and indicates the error of dangling
RULES FOR DRAWING NETWORK DIAGRAM
For
a perfect network diagram, the following rules should be followed:
❖ Each activity is represented by one and only one arrow in
the network
❖ No two activities can be identified by the same end events
❖ Ensure the correct precedence relationship in the arrow
diagram and check for hierarchy whenever any activity is added to the network
❖ Try to avoid arrows which cross each other and Use straight
arrows
❖ Do not attempt to represent duration of activity by its
arrow length
❖ Use arrows from left to right. Avoid mixing two directions,
vertical and standing arrows may be used if necessary.
❖ Use dummies freely in rough draft but final network should
not have any redundant dummies.
❖ The network has only one entry point called start event and
one point of emergence called the end event.
BASIC STEPS IN PERT / CPM
In
general construction project scheduling by PERT / CPM consists of the following
four main steps:
(i) Planning: The planning phase is started by
splitting the total project in to small projects. These smaller projects in
turn are divided into activities and are analyzed by the department or section.
The relationship of each activity with respect to other activities are defined
and established and the corresponding responsibilities and the authority are
also stated. Thus the possibility of overlooking any task necessary for the
completion of the project is reduced substantially.
(ii) Scheduling: The ultimate objective of the
scheduling phase is to prepare a time chart showing the start and finish times
for each activity as well as its relationship to other activities of the
project. Moreover the schedule must pinpoint the critical path activities which
require special attention if the project is to be completed in time. For
non-critical activities, the schedule must show the amount of slack or float
times which can be used advantageously when such activities are delayed or when
limited resources are to be utilized effectively.
(iii) Resource allocation: Allocation of resources is performed
to achieve the desired objective. A resource is a physical variable such as
labour, finance, equipment and space which will impose a limitation on time for
the project. When resources are limited and conflicting, demands are made for
the same type of resources a systematic method for allocation of resources
become essential. Resource allocation usually incurs a compromise and the
choice of this compromise depends on the judgment of managers.
(iv) Controlling: The final phase in project
management is controlling. Critical path methods facilitate the application of
the principle of management by expectation to identify areas that are critical
to the completion of the project. By having progress reports from time to time
and updating the network continuously, a better financial as well as technical
control over the project is exercised. Arrow diagrams and time charts are used
for making periodic progress reports. If required, a new course of action is
determined for the remaining portion of the project.
In addition to these basic steps
essentially, there are six steps which are common to both the CPM and PERT
techniques. They are listed as follows:
(i)
Define the Project and all of its significant activities or tasks. The Project
(made up of several tasks) should have only a single start activity and a
single finish activity.
(ii)
Develop the relationships among the activities. Decide which activities must
precede and which must follow others.
(iii)
Draw the "Network" connecting all the activities. Each Activity
should have unique event numbers. Dummy arrows are used where required to avoid
giving the same numbering to two activities.
(iv) Assign time and/or cost estimates
to each activity
(v)
Compute the longest time path through the network. This is called the critical
path.
(vi) Use the Network to help plan,
schedule, and monitor and control the sonog project.
CRITICAL PATH METHOD IN NETWORK ANALYSIS
Critical
Path Method (CPM) was developed in the late 1950s as a method to resolve the
issue of increased costs due to inefficient scheduling. Since then, CPM has
become popular for planning projects and prioritizing tasks. It helps to break
down complex projects into individual tasks and gain a better understanding of
the project's flexibility. The Key Concept used by CPM is that a small set of
activities, which make up the longest path through the activity network control
the entire project. Such activity is called as critical activity. A critical
path in project management is the longest sequence of activities that must be
finished on time in order for the entire project to be complete. Any delays in
critical tasks will delay the rest of the project. Non-critical activities can
be re-planned, rescheduled and resources for them can be reallocated flexibly,
without affecting the whole project. CPM revolves around discovering the most
important tasks in the project timeline, identifying task dependencies, and
calculating task durations. CPM has single time estimate which is assumed to be
deterministic.
Basic
Scheduling Computations in CPM
The basic notations used in CPM can be
explained as follows:
For the given example,
(i,j)
= Activity "A" with tail event "i" and head event "j”
Ei
= Earliest occurrence time of event i
Ej = Latest al owable occurrence time of event j
D i j = Estimated completion
time of activity (i, j)
(ES)U
= Earliest starting time of activity (i, j)
(EF)
i j = Earliest finishing time of activity
(i, j)
(LS)
i j = Latest starting time of activity
(i, j)
(Lf)ij = Latest
finishing time of activity (i, j)
(i)
Determination of Earliest time (Ej): Forward Pass computation
Step
1
The
computation begins from the start node and move towards the end node. For
easiness, the forward pass computation starts by assuming the earliest
occurrence time of zero for the initial project
event.
Step
2
Earliest
starting time of activity (i, j) is the earliest event time of the tail end
event
i.e. (Es)ij
= Ei
Earliest
finish time of activity (i, j) is the earliest starting time + the activity
time
i.e.
(Ef)ij = (Es)ij
+ Dij or (Ef)ij = Ei + Dij
Earliest
event time for event j is the maximum of the earliest finish times of all
activities ending in to that event
i.e.
Ej =
max [(Ef)ij for all immediate predecessor of (i, j)] or
Ej
= max [Ei + Dij]
(ii)
Backward Pass computation (for latest allowable time)
Step
1
For
ending event assume E = L.
Also all E's have been computed by
forward pass computations.
Step
2
Latest
finish time for activity (i, j) is equal to the latest event time of event j.
i.e. (Lf)ij = Lj
Step
3
Latest
starting time of activity (i, j) = the latest completion time of (i, j) - the
activity time bollo ons omisioak
i.e.
(Ls)ij = (Lf)ij
- Dij or (Ls)ij = Lj - Dij
Step
4
Latest
event time for event '' is the minimum of the latest start time of all
activities originating from that event
i.e. Li = min [(Ls)ij
for all immediate successor of (i, j)] min [Lf )ij- Dij]
= min [Lj – Dij]
(iii)
Determination of floats and slack times
There are
three kinds of floats as follows:
❖ Total float - The amount of time by which the
completion of an activity could be delayed beyond the earliest expected
completion time without affecting the overall project duration time.
(Tf)
ij Latest start - Earliest start) for activity (i −j)
i.e. = (Tf) ij = (Ls)ij
- (Es)ij or (Tf)ij = (TL-TE)
- tij
❖ Free float The time by which the completion of
an activity can be delayed beyond the earliest finish time without affecting
the earliest start of a subsequent activity.
(Ff) ij = Total float - Head event slack
i.e.
(Ff ) = (Ej –Ei)
-tij
❖ Independent float - The amount of time by which the start of an
activity can be delayed without effecting the earliest start time of any
immediately following activities, assuming that the preceding activity has
finished at its latest finish time. The negative independent float is always
taken as zero.
(If)ij
= Free float - Tail event slack
i.e.
(If)ij =
(Ej - Li) - tij
❖ Event slack - It is defined as the difference
between the latest event and
earliest event times.
Head
event slack = Lj - Ej
Tail
event slack = Li - Ei
(iv)
Determination of critical path
❖ Critical event - The events with zero slack times
are called critical events. In other words the event i is said to be critical
if Ei = Li
❖ Critical activity - The activities with zero total
float are known as critical activities. In other words an activity is said to
be critical if a delay in its start will cause a further delay in the completion
date of the entire project.
❖ Critical path - The sequence of critical activities
in a network is called critical path. The critical path is the longest path in
the network from the starting event to ending event and defines the minimum
time required to complete the project.
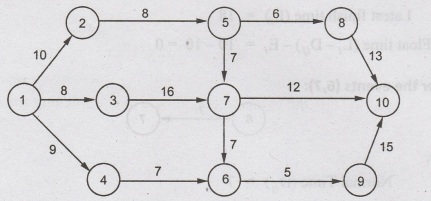
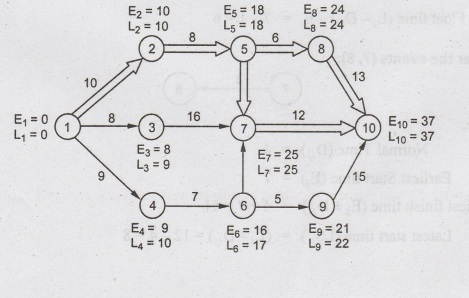
Example 1 :
Determine
the early start and late start in respect of all node points and identify
critical path for the following network.
Solution:
In
the networks shown, there are many paths by which the last event can be
achieved.
Consider
the events (1, 3):
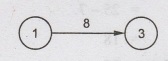
Here,
Normal
Time (Dij) = 8
Earliest
Start time (Ei) = 0 (Event 1 has no preceding event Ei
= 0)
Earliest
finish time (Ei + Dij) = 0+8=8
Latest
start time (LSij) = (Li-Dij) = 9-8=1
Latest
finish time (Li) = 9
Float
time (Li -Dij) – Ei = 1-0 = 1
Consider
the events (2,5):
Here,
Normal
Time (Dij) = 8
Earliest
Start time (Ei) = 10
Earliest
finish time (Ei + Dij) = 10+8 =18
Latest
start time (LSij) = (Li- Di j) = 18-8=10
Latest
finish time (Li) = 18
Float
time (Li-Dij) - Ei
= 10-10 = 0
Consider
the events (6,7):
Normal
Time (Dij) = 7
Earliest
Start time (Ei) = 16
Earliest
finish time (Ei + Dij) = 16+7 =23
Latest
start time (LSij) = (Li- Di j) = 25-7=18
Latest
finish time (Li) = 25
Float
time (Li - Dij) - Ei
= 18-16 = 2
Consider
the events (8, 10):

Here,
Normal
Time (Dij) = 13
Earliest
Start time (Ei) = 24
Earliest
finish time (Ei + Dij) = 24+13 =37
Latest
start time (LSij) = (Li- Di j) =37-13=24
Latest
finish time (Li) = 37
Float
time (Li - Dij) - Ei
= 24-24 = 0
Likewise all the other nodes can be
solved and network analysis table can be
Network
Analysis Table
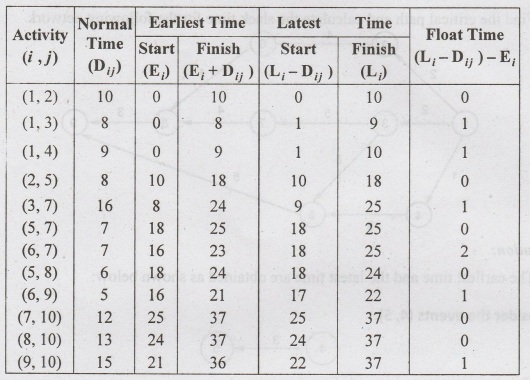
From
the table, the critical nodes are (1, 2), (2, 5), (5, 7), (5, 8), (7, 10) and
(8, 10)
From the table, there are two possible
critical paths
(i) 1→2→5→
8 → 10
(ii) 1→2→
5→710
Calculation
of E and L for each node is shown in the network below:
Example
2
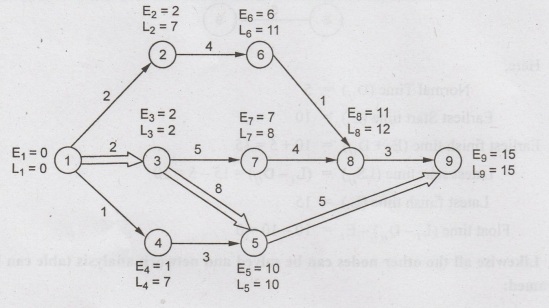
Find
the critical path and calculate the slack time for the following network
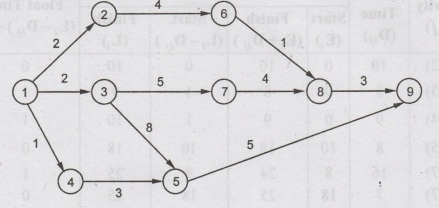
Solution:
The earliest time and the latest time
are obtained as shown below:
Consider
the events (4, 5):
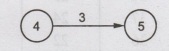
Here,
Normal
Time (Dij) = 3
Earliest
Start time (Ei) = 1
Earliest
finish time (Ei + Dij) =
3 + 1 = 4
Latest
start time (LSij) = (Li- Di j) = 10- 3 = 7
Latest
finish time (Li) = 7
Float
time (Li - Dij) - Ei
= 7 - 1 = 6
Consider
the events (7, 8):
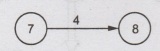
Here,
Normal
Time (Dij) = 4
Earliest
Start time (Ei) = 7
Earliest
finish time (Ei + Dij) =
4 + 7 = 11
Latest
start time (LSij) = (Li- Di j) = 12-4= 8
Latest
finish time (Li) = 12
Float
time (Li - Dij) - Ei
= 8 - 7 = 1
Consider
the events (5, 9):
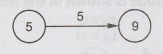
Here,
Normal
Time (Dij) = 5
Earliest
Start time (Ei) = 10
Earliest
finish time (Ei + Dij) = 10+5 = 15
Latest
start time (LSij) = (Li- Di j) = 15-5 = 10
Latest
finish time (Li) = 15
Float
time (Li - Dij) - Ei
= 10-10 = 0
Likewise
all the other nodes can be solved and network analysis table can be framed:
Network
Analysis Table
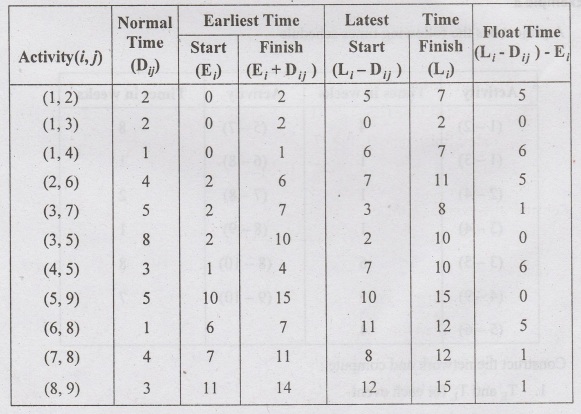
From
the above table, the critical nodes are the activities (1, 3), (3, 5) and (5,9)
The
critical path is 1→3→ 5→ 9
Calculation
of E and L for each node is shown in the network below:
Example
3
A
project has the following times schedule
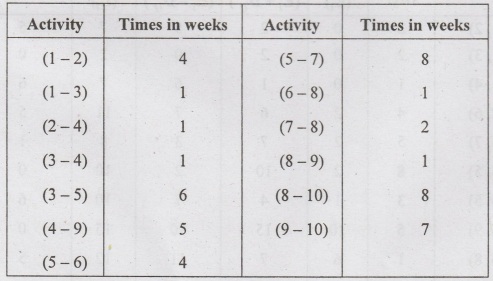
Construct the network and compute :
1.
TE and TL for each event
2.
Float for each activity
3.
Critical path and its duration
Solution:
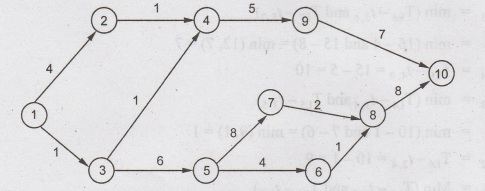
The
network diagram can be drawn as shown below:
To
determine the critical path, the earliest time TE and latest time T1 for each
of the TL
activity
of the project is to be computed.
To
calculate TE for all activities,
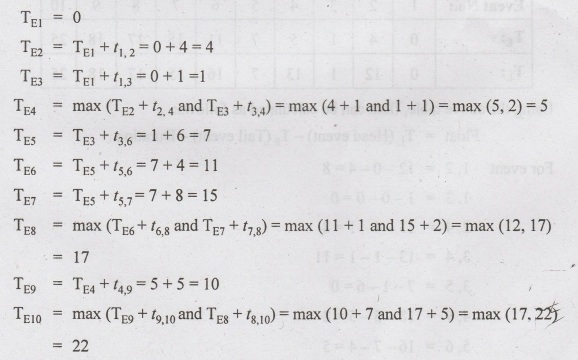
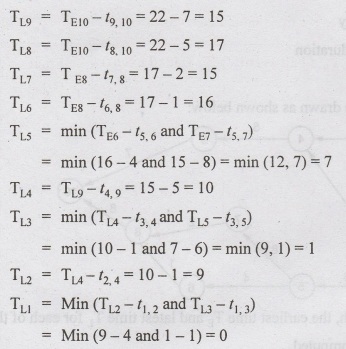
To
calculate T, for all activities
TL10 = TE10 = 22
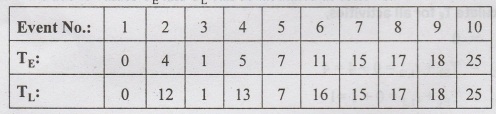
From
the above values TE and T can be tabulated as follows:
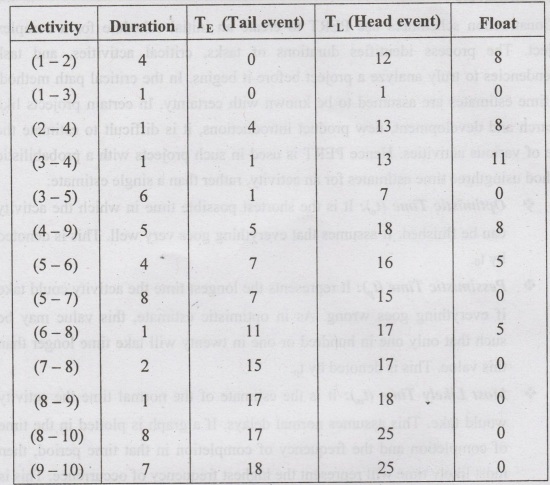
Using
the above table, float can be calculated as follows:
Float
= TL (Head event) - TE (Tail event) - Duration
For
event 1,2 = 12-0-4=8
1,3
= 1-0-0=0
2,4
13-4-1=8
3,4
13-1-1=11
3,5
7-1-6=0
4,9 18-5-5=8
5,616-7-4=5
5,7
5-7-8=0
6-8
17-11-1=5
Likewise,
the float for all events can be tabulated as follows:
Calculation
of E and L for each node is shown in the network below
The
resultant network shows the critical path
1→35→78→10
PROGRAM EVALUATION AND REVIEW TECHNIQUE (PERT) IN NETWORK
ANALYSIS
Construction schedulers use PERT to
create an initial schedule for a complex project. The process identifies
durations of tasks, critical activities, and task dependencies to truly analyze
a project before it begins. In the critical path method, the time estimates are
assumed to be known with certainty. In certain projects like research and
development, new product introductions, it is difficult to estimate the time of
various activities. Hence PERT is used in such projects with a probabilistic
method usingthree time estimates for an activity, rather than a single
estimate:
❖ Optimistic Time (to): It is the shortest possible time in which the
activity can be finished. It assumes that everything goes very well. This is
denoted by to.
❖ Pessimistic Time (tp) It represents the longest time the activity could take if everything goes
wrong. As in optimistic estimate, this value may be such that only one in
hundred or one in twenty will take time longer than this value. This is denoted
by tp. (t):
❖ Most Likely Time (tm): It is the estimate of the normal
time the activity would take. This assumes normal delays. If a graph is plotted
in the time of completion and the frequency of completion in that time period,
then most likely time will represent the highest frequency of occurrence. This
is denoted by tm.
PERT
scheduling is used instead of CPM scheduling if the duration of tasks isn't
straightforward. Hence PERT scheduling is a good option at the beginning of a
project when actual duration of the project is not known. The PERT schedule may
eventually become a schedule that resembles the CPM once more information can
be determined about construction tasks. Taking all these time estimates into
consideration, the expected time of an activity is arrived as follows:
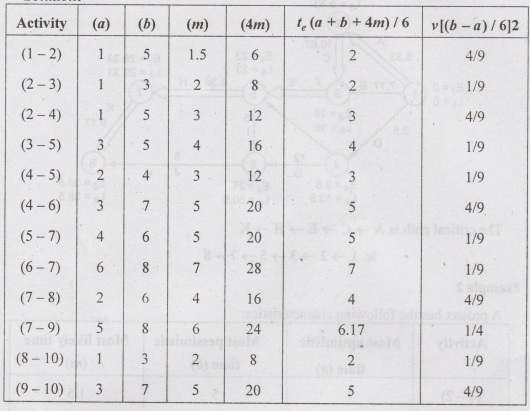
❖ Expected time -
It is the average time an activity will take if it were to be repeated on large
number of times and is based on the assumption that the activity time follows
Beta distribution, this is given by
te = (to +4 tm + tp)/6
❖ The variance for the activity is
given by
σ 2 = [(tp-t0)/6]2
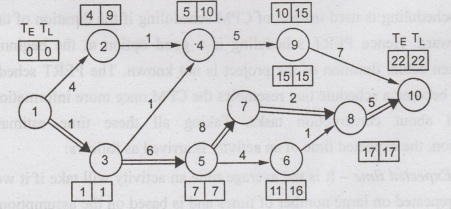
Example
1
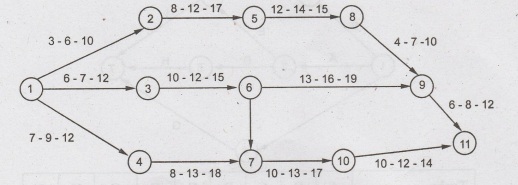
For
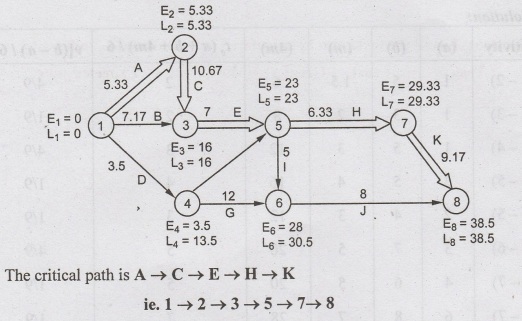
the project shown in the figure

Find the earliest and latest expected
time to each event and also critical path in the network.
Solution:
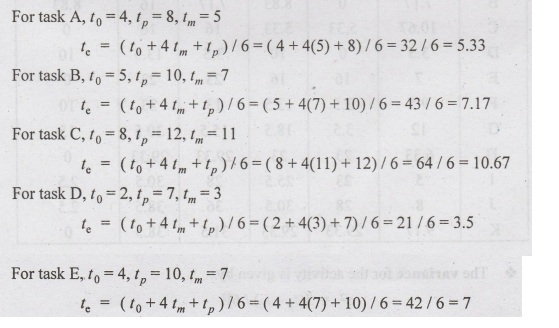
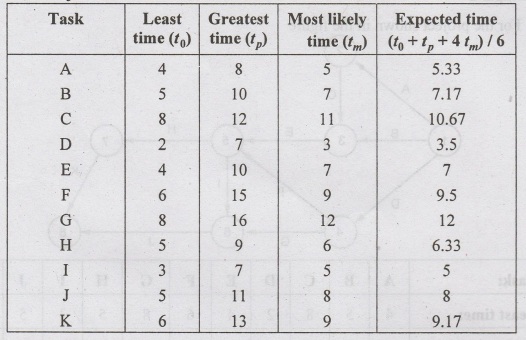
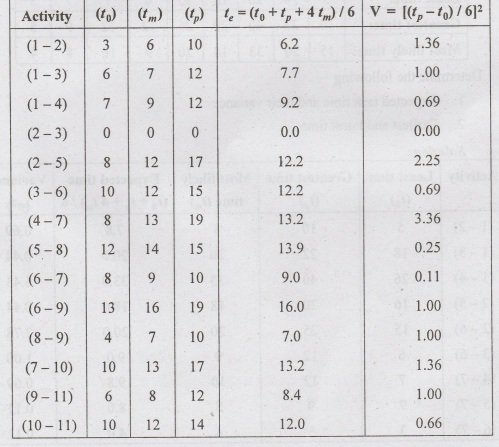
Likewise te for all the tasks can be
calculated and tabulated as follows:
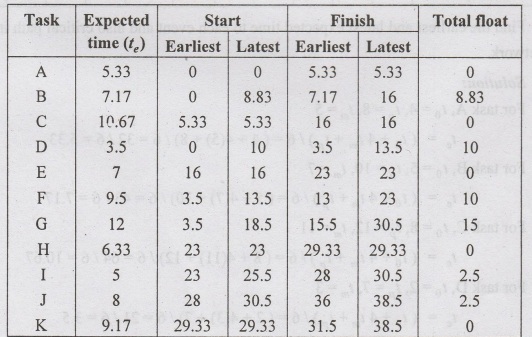
From
the te calculated Earliest start time and Earliest finish time can
be calculated as follows:
The network diagram can be drawn as
shown below:
Example
2
A
project has the following characteristics:
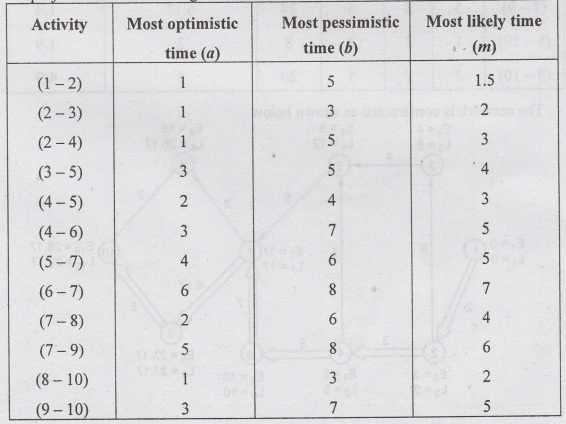
Construct a PERT network. Find the
critical path and variance for each event.
Solution:
The
network is constructed as shown below
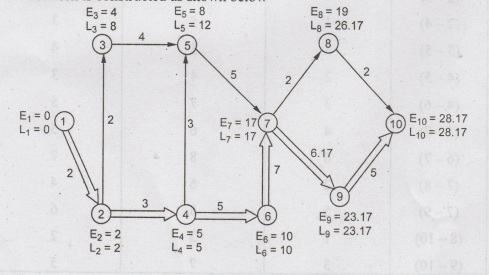
The
critical path = 1→2→4→6-7-9-10
Example
3
Calculate
the variance and the expected time for each activity
Example
4
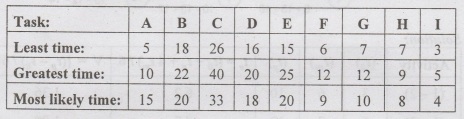
A
project is represented by the network as shown below and has the following
data
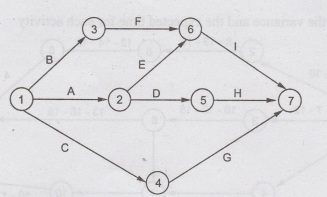
Determine
the following
1.
Expected task time and their variance
2.
Earliest and latest time
Solution:
Activity Least time Greatest time
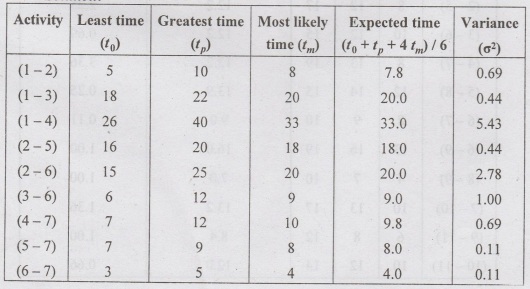
Earliest
time can be calculated as follows:
E1 = 0
E2
= 0+7.8 7.8
E3 = 0+20=20
E4
= 0+33=33
E5
= 7.8+18=25.8
E6
= max [7.8 + 20, 20 + 9] = 29
E7 = max [33 +9.8, 25.8+ 8,
29+ 4] = 42.8
Latest
time can be calculated as follows:
L7 = 42.8
L6
= 42.8-438.8
L5
= 42.8-8= 34.3
L4
= 42.8 9.833
L3
= 38.8-9 29.8
L2
min [34.8-18, 38.8-20]= 16.8
L1
= min [16.8-7.8, 29.8-20, 33-33]=0
DIFFERENCE BETWEEN PERT
AND CPM
❖ PERT
is probabilistic in nature. It acknowledges and considers the variability in
completion; times of activities and, in turn, the project. Accordingly it is
useful for analyzing project scheduling problems with of bozu uncertain
completion times of the activitiesinvolved.
❖ CPM
is deterministic in nature. It is most appropriately used in projects in ubivib
which activity durations are known with certainty. Not only the amount of
time
needed to complete various facets of the project but also the amount of
resources required for performing each of the activities are assumed to be
known and certain.
❖ PERT
is useful for projects that are new, non-repetitive, or which involve research
and development while CPM is of great value for projects that are repetitive
and standardized, like those involving construction activities
❖ PERT
focuses primarily on time element and attaches lesser significance to the cost.
CPM puts strong emphasis on cost and specifically considers the time-cost
relationshipand trade-off.
❖ PERT
is event oriented so that probabilities of reaching various events by certain
dates may be calculated through event variances. CPM is activity oriented.
ADVANTAGES AND
DISADVANTAGES OF PERT AND CPM
PERT/CPM
has the following advantages:
❖ A
PERT/CPM chart explicitly defines and makes visible dependencies (precedence
relationships) between the elements,
❖ PERT/CPM
facilitates identification of the critical path and makes this visible,
❖ PERT/CPM
facilitates identification of early start, late start, and slack for each
activity,
❖ PERT/CPM
provides for potentially reduced project duration due to better understanding
of dependencies leading to improved overlapping of activities and tasks where
feasible.
PERT/CPM
has the following disadvantages:
❖ The
lack of a timeframe on most PERT/CPM charts makes it harder to show status
although colours can help (e.g., specific colour for completed nodes),
❖ When
the PERT/CPM charts become unwieldy, they are no longer used to manage the
project.
❖ There
can be potentially hundreds or thousands of activities and individual
dependency relationships will be complicated for big projects.
Construction Materials And Technology: UNIT V: Construction Planning : Tag: : Construction Planning - CPM and Pert Network Modelling and Time Analysis
Related Topics
Related Subjects

Construction Materials and Technology
CE3302 3rd Semester Civil Dept 2021 Regulation | 3rd Semester Civil Dept 2021 Regulation